Identify Risky Files in Your Git Repositories
Software teams often wrestle with the question: Where should we focus our refactoring, testing, or documentation efforts? I’ve released my Git Churn Calculator, a lightweight, practical, cross-platform (Linux, Windows, macOS) tool that answers this by calculating a Churn Risk Score for every file in a Git repository.
How It Will Help Your Product Quality
Churn analysis is useful because change tends to cluster where risk lives: files that are edited often are usually important to the product, heavily coupled, or hard enough to work with that every feature touches them again. You cannot give every module the same depth of review or testing; measuring churn gives you an objective way to prioritize—so you spend effort where instability and many hands intersect, and you can track over time whether tests or refactors actually calm those hotspots.
What Is Churn Risk?
High churn — files that change frequently — often correlates with higher bug rates and maintenance costs. The tool goes beyond simple change counts by combining:
- Change frequency (commits over the file’s lifetime, normalized to changes per week)
- Author spread (number of distinct developers who have modified the file)
- Optional test coverage (from Cobertura XML reports), which lowers the risk score for well-tested files
The resulting scrore surfaces the files that are both volatile and potentially under-tested prime candidates for attention. You want to invest here into tests and probably refactoring as well.
How the Score Is Calculated
For each tracked file:
- Without coverage: ChurnRiskScore = ChangesPerWeek × TotalUniqueAuthors
- With coverage: The score is multiplied by (1 - CoveragePercent/100), so fully covered files see their risk reduced dramatically (down to zero, ignoring rounding).
All metrics are derived directly from git log data, with careful handling of dates and rolling windows. Time-series mode re-anchors every calculation to the end of each bucket, giving you an accurate historical view.
It is strongly recommended to include the coverage in the calculation!
Key Features
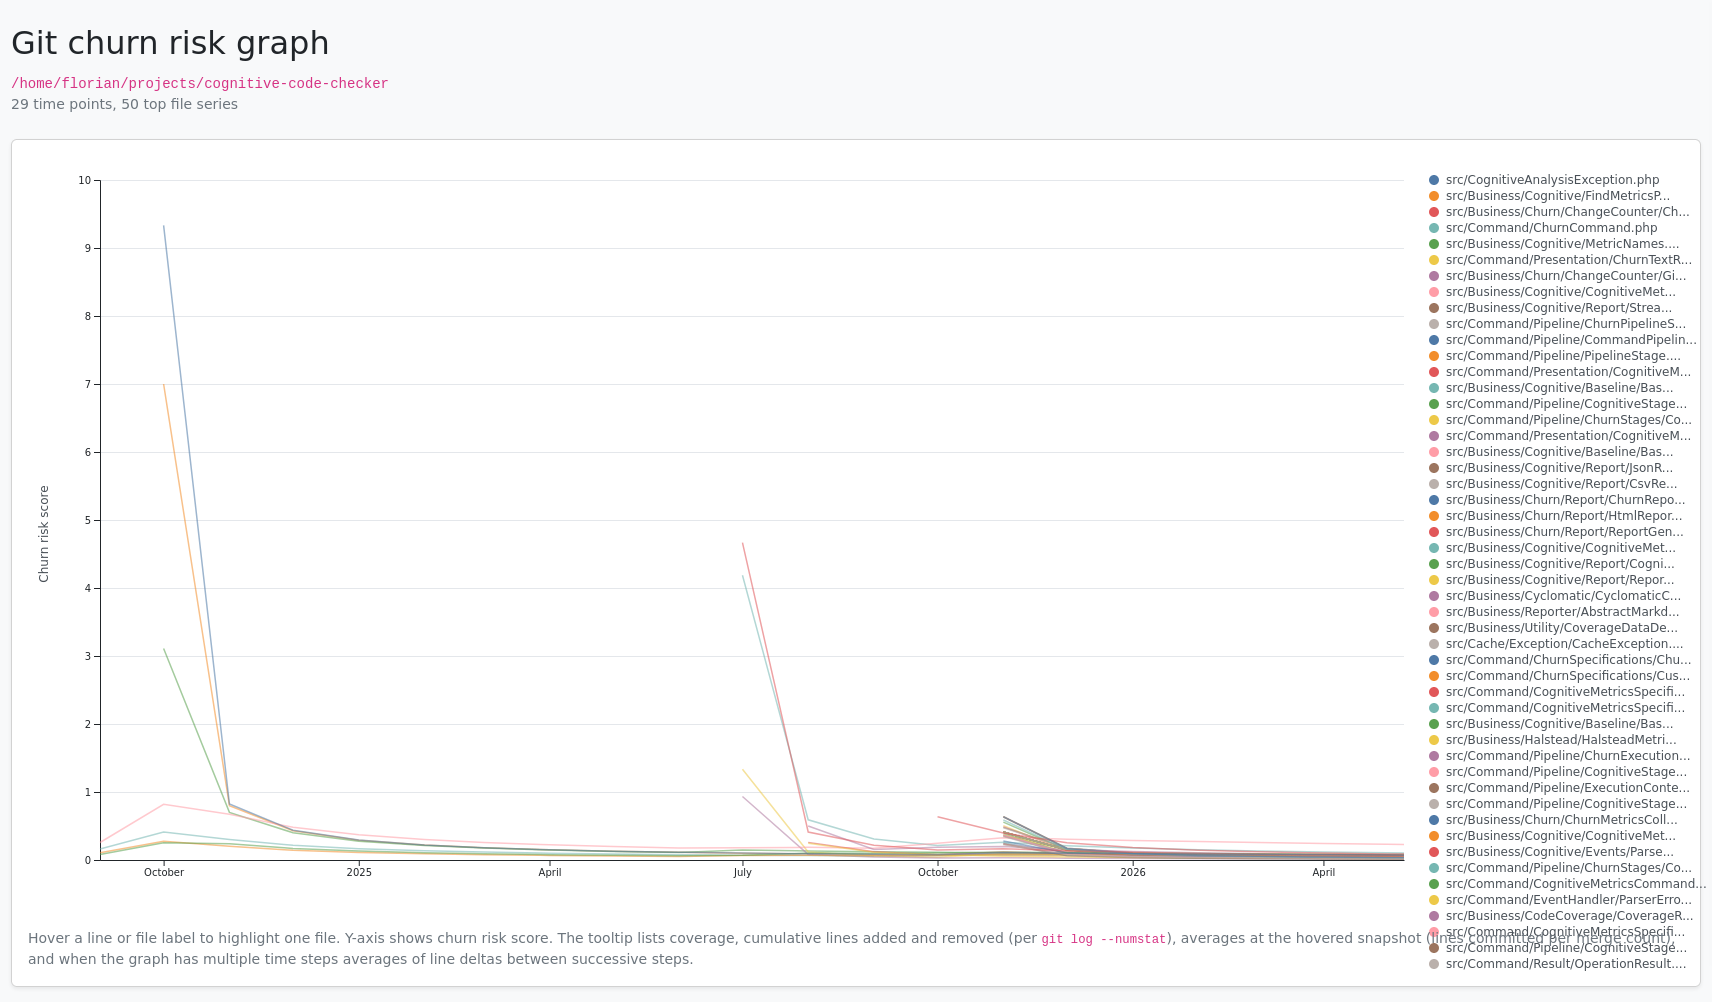
- Multiple output formats: CSV (default, great for spreadsheets), JSON, interactive HTML tables (Bootstrap-styled), and even a D3-powered time-series graph.
- Flexible filtering: Include or exclude files with regular expressions (e.g., focus only on src/*/.cs files).
- Time-series analysis: Generate weekly or monthly snapshots to track how risk evolves over time (–series week –from 2024-01-01).
- Coverage integration: Supply a Cobertura XML file to factor in test coverage. Poorly covered, high-churn files get penalized more heavily.
Get it
The project is open source under the MIT License. Head to the repository to try it:
https://github.com/floriankraemer/git-churn-calculator
Happy churning (the analytical kind)!